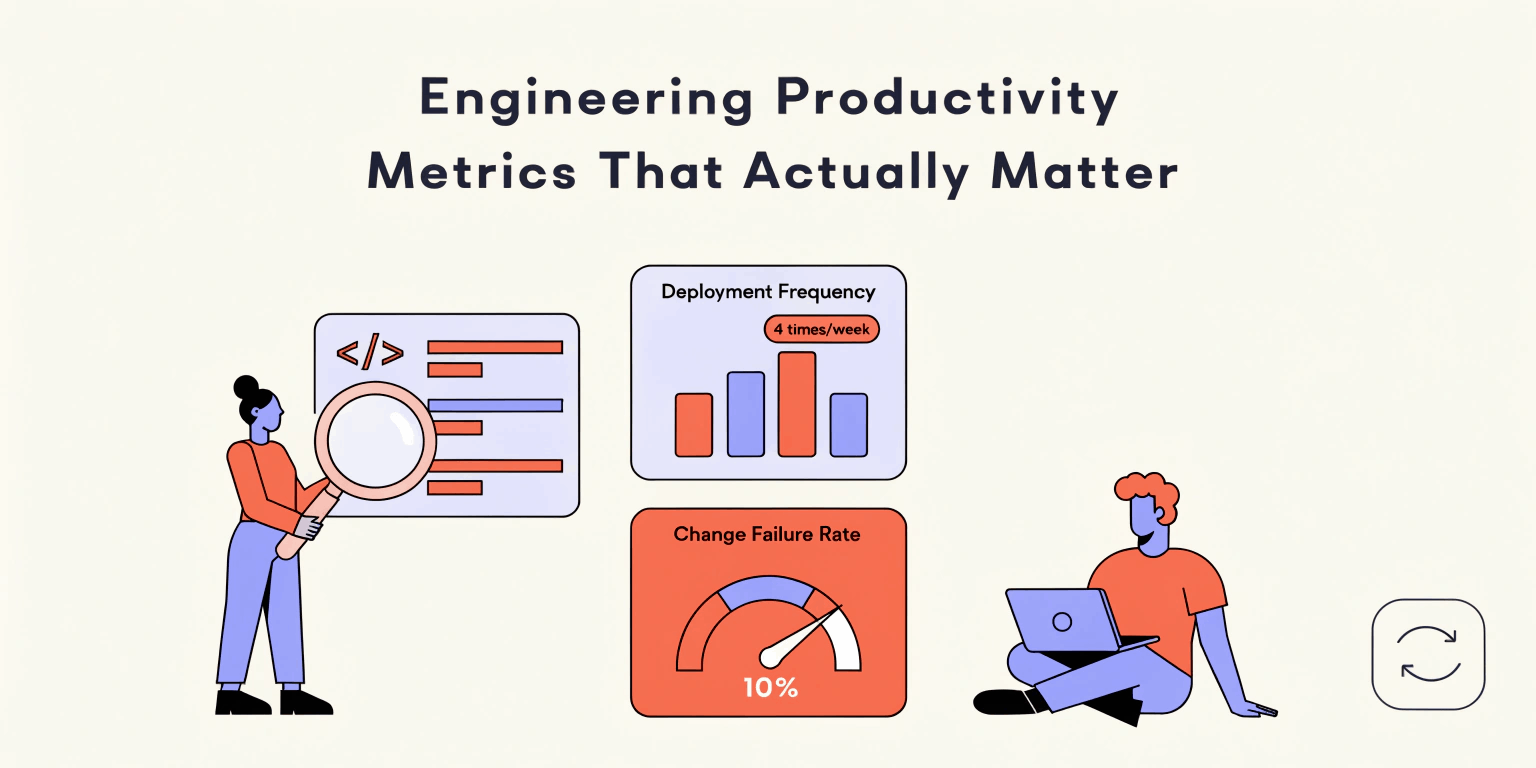
Effective engineering productivity measurement focuses on outcomes rather than activity. Metrics such as deployment frequency, lead time, change failure rate, recovery time, cycle time, reliability, developer experience, and team health provide better insights than lines of code or hours worked.
Engineering productivity is often misunderstood. Organizations sometimes measure productivity using lines of code, hours worked, number of commits, or tickets completed. While these metrics are easy to collect, they rarely explain whether an engineering team is actually delivering valuable software efficiently.
A developer can write thousands of lines of code that later need to be removed, while another developer can solve a complex problem with a few lines of code. Similarly, a team completing hundreds of tickets may not be delivering meaningful business value.
Effective productivity measurement should therefore focus on software delivery outcomes, quality, reliability, developer experience, and sustainable team performance.
1. Deployment Frequency
Deployment frequency measures how often an engineering team successfully releases changes to production.
A higher deployment frequency can indicate an efficient delivery pipeline, smaller changes, strong automation, and effective collaboration.
However, frequency alone should not become a target. Teams should not release unnecessary changes simply to increase the number.
The useful question is:
How easily can the team safely deliver valuable changes to users?
2. Lead Time for Changes
Lead time measures how long it takes for a code change to move from development to production.
A shorter lead time generally means that teams can deliver improvements faster and receive feedback sooner.
Long lead times can reveal bottlenecks such as:
- Slow code reviews
- Manual testing
- Complex approval processes
- Fragile deployment pipelines
- Environment problems
- Large batches of changes
Reducing these bottlenecks can improve productivity without requiring developers to work longer hours.
3. Change Failure Rate
Speed without quality is not productivity.
Change failure rate measures the percentage of deployments that result in problems requiring remediation, rollback, hotfixes, or other corrective actions.
A team deploying 50 times per week but frequently causing production incidents may be less effective than a team deploying 20 stable releases.
This metric should therefore be evaluated alongside deployment frequency and lead time.
4. Time to Restore Service
When something goes wrong, how quickly can the engineering team recover?
Time to restore service measures the time required to recover from production failures or incidents.
A strong engineering organization does not assume that failures can be eliminated completely. Instead, it builds systems that make failures easier to detect, diagnose, and recover from.
Observability, automated rollback, feature flags, monitoring, and incident-response processes can significantly improve recovery performance.
5. Cycle Time
Cycle time measures the time required to move work through a particular development process.
For example, teams can measure the time from:
First commit → Pull request → Review → Merge → Deployment
Breaking cycle time into stages is particularly useful because it identifies where work is waiting.
If code spends two days waiting for review but only two hours being actively developed, increasing developer coding speed will not solve the real problem.
6. Pull Request Health
Pull request metrics can provide useful insights when interpreted carefully.
Teams can examine:
- Review turnaround time
- Pull request size
- Number of review iterations
- Time from approval to merge
- Stale pull requests
Large pull requests often take longer to review and may increase the chance of defects.
The objective should not be to minimize pull-request size artificially, but to encourage changes that are reasonably sized and easy to understand.
7. Code Quality and Reliability
Productivity should include the quality of the software being produced.
Useful indicators include:
- Production defect rates
- Automated test coverage trends
- Escaped defects
- Static-analysis findings
- Reliability metrics
- Incident frequency
- Technical-debt trends
No single quality metric tells the complete story.
For example, test coverage can increase while important scenarios remain untested. Teams should therefore combine automated measurements with engineering judgment.
8. Developer Experience
Developer experience, often called DevEx, is becoming an important productivity indicator.
Engineers lose significant time when development environments are slow or unreliable.
Organizations can measure:
- Development environment setup time
- Build duration
- CI pipeline duration
- Test execution time
- Deployment friction
- Tool reliability
- Internal platform satisfaction
Improving these areas can produce substantial productivity gains because the benefits are repeated across the entire engineering organization.
9. Unplanned Work
Unplanned work is another valuable metric.
Production incidents, urgent customer requests, unexpected maintenance, and operational problems can interrupt planned development.
If engineers spend a large percentage of their time on unplanned work, sprint commitments may become unreliable.
Tracking planned versus unplanned work can help engineering leaders identify systemic problems rather than blaming developers for missed deadlines.
10. Engineering Team Health
Productivity should also be sustainable.
Organizations can monitor indicators such as:
- Workload balance
- On-call burden
- Employee retention
- Developer satisfaction
- Context switching
- Meeting overhead
- Interruptions
- Sustainable working patterns
A team that consistently delivers while maintaining healthy working practices is more valuable than a team that achieves short-term output through excessive pressure.
Avoid Vanity Metrics
Some metrics look impressive but can encourage harmful behavior.
Lines of code may reward unnecessary complexity.
Number of commits may encourage developers to split work artificially.
Number of tickets closed may encourage teams to prioritize easy tasks.
Hours worked can reward inefficient processes and discourage healthy boundaries.
Story points completed can become misleading if teams start optimizing the numbers instead of outcomes.
Metrics should provide information—not become a game.
Use Metrics as Diagnostic Tools
The best engineering metrics answer questions such as:
- Where is work getting delayed?
- Why are deployments failing?
- Where is developer time being lost?
- Which processes create unnecessary waiting?
- Are production problems increasing?
- Is technical debt affecting delivery?
- Is the team able to maintain sustainable performance?
Metrics should trigger investigation rather than automatically trigger judgment.
For example, if lead time suddenly increases, engineering leaders should investigate whether code reviews, testing, infrastructure, or deployment processes are responsible.
Build a Balanced Productivity Framework
A useful engineering productivity dashboard can combine several categories:
Delivery: deployment frequency, lead time, cycle time.
Reliability: change failure rate, incident frequency, recovery time.
Quality: defects, escaped bugs, code-health indicators.
Developer Experience: build time, CI performance, environment reliability.
Team Health: workload, interruptions, on-call burden, satisfaction.
No single metric can accurately describe engineering productivity.
The most effective organizations use a balanced set of indicators to understand how teams work, where systems create friction, and whether software delivery is improving.
Ultimately, engineering productivity is not about making developers produce more code. It is about helping teams deliver valuable, reliable software with less unnecessary friction. When productivity metrics focus on outcomes, flow, quality, reliability, and developer experience, engineering leaders can make better decisions while giving developers the environment they need to do their best work.
We build scalable web, mobile, and game products for clients worldwide — combining modern frameworks, cloud infrastructure, and best engineering practices.
.jpg)
.jpg)
.jpg)